Image: Portsmouth City Council
Since 2014, Portsmouth has invested more in solar than any other council in the UK according to new research.
The Solar Centre utilised council data gathered through Freedom of Information (FOI) requests that explored council spending on solar installations since the 2014/2015 financial year. Portsmouth came out on top, with an investment of £4,995,707 up to 2020 in the technology.
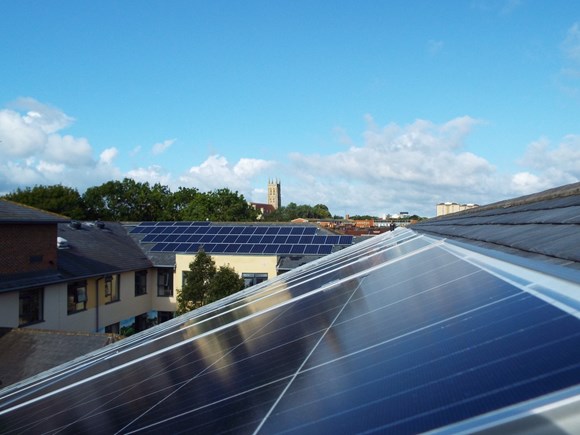
Portsmouth began a solar rollout scheme worth up to £10 million for council buildings in 2016. This helped it achieve a record amount of solar generation during the first COVID-19 lockdown last year, with the council’s solar panels - which sit on schools, offices, community centres and housing sites - generating 1.3GWh of power.
More recently, it has begun work on the flagship Portsmouth International Port solar and battery storage project, which is set to be the first UK port to have solar canopies and a megawatt sized battery installed as part of a renewable installation.
The Solar Centre also looked at the varying budget sizes of councils, ranking investment in solar energy per million pound of council budget.
Within this metric, the London Borough of Merton won out, spending just over £1.4 million on solar energy over the past five and a half years, or £130,000 per million.
Top ten councils for solar investment per million pounds of council budget:
| # | Council | Solar investment per £M budget (2015-2020) |
|---|---|---|
| 1 | London Borough of Merton | £130,141 |
| 2 | Plymouth | £67,544 |
| 3 | Perth | £45,272 |
| 4 | Lichfield | £31,240 |
| 5 | Portsmouth | £19,973 |
| 6 | Inverness | £14,237 |
| 7 | Exeter | £13,678 |
| 8 | Dundee | £12,867 |
| 9 | Bristol | £10,463 |
| 10 | Cardiff | £8,110 |
Additionally, it looked at the areas with the most solar fitted buildings, with Newcastle-upon-Tyne coming top of the table with 1,032 council owned properties fitted with solar panels.
Peterborough produced the most power energy from council owned solar during the period, with over 295 million kWh, although the Solar Centre notes that results were adjusted per 100,000 capita for validity.
Most PV fitted buildings:
| # | City | Number of buildings |
|---|---|---|
| 1 | Newcastle-upon-Tyne | 1,032 |
| 2 | Leeds | 968 |
| 3 | Birmingham | 763 |
| 4 | Perth | 522 |
| 5 | Portsmouth | 373 |
| 6 | Exeter | 294 |
| 7 | Oxford | 221 |
| 8 | Cambridge | 198 |
| 9 | Inverness | 97 |
| 10 | Sheffield | 80 |
Brian Davenport, director of The Solar Centre said it was interesting to see council activity and how the councils are targeting net zero by 2050.
“Of course, there are many areas councils need to invest in besides solar, but it is always nice when we see the likes of Portsmouth, Merton and Plymouth continually showing passion and investment in solar energy in their city.”
Most solar energy produced:
| # | Council | Energy produced - kWh per 100,000 capita |
|---|---|---|
| 1 | Peterborough | 146,000,000 |
| 2 | Winchester | 69,165,992 |
| 3 | City of London | 17,588,341 |
| 4 | Portsmouth | 7,935,873 |
| 5 | Exeter | 5,917,554 |
| 6 | Newcastle-upon-Tyne | 3,278,311 |
| 7 | London Borough of Hounslow | 3,065,262 |
| 8 | London Borough of Merton | 2,677,775 |
| 9 | Oxford | 2,388,214 |
| 10 | Perth | 1,845,018 |
The data used was collected between September 11 and October 29, and as such only partially reflects installations in 2020.